Conflict Resolution Survey
Conflict Resolution Survey Results 2002
Total Participation = 227
| Overall: | Satisfied 86% (195) |
| Unsatisfied 14% (31) | |
| Faculty Staff | N = 81 N = 112 |
| Satisfied 95% (77) Satisfied 76% (85) | |
| Unsatisfied 5% (4) Unsatisfied 24% (27) | |
| Note: One "satisfied" person did not indicate category and was not included only in the overall results. One individual created his/her own category in between satisfaction and dissatisfaction. This person was counted in the "unsatisfied" group for purposes of tallying the results. | |
| Administrators | N = 26 |
| Satisfied 100% (26) | |
| Unsatisfied 0% (0) | |
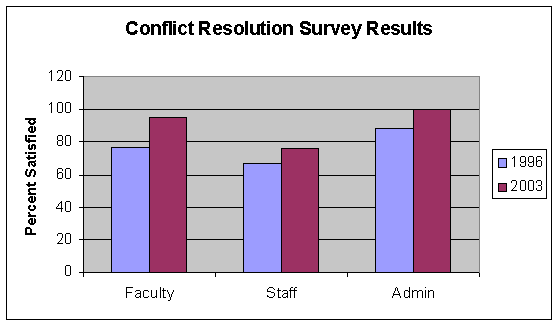
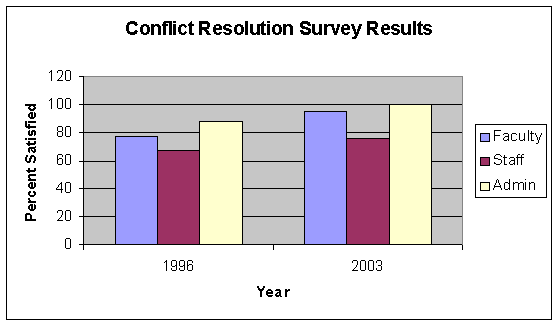
Summary: Results for this survey parallel those of the previous conflict resolution survey in 1996. Administrators are, once again, the happiest group on campus with the state of conflict resolution. As in the earlier results, faculty are significantly more satisfied than staff with conflict resolution on campus. Interestingly, satisfaction levels for 2002 are considerably higher than in the previous survey, with staff at 76% satisfaction as compared to 67% in 1995, faculty at 95% as compared to 77%, and administrators at 100% as compared to 88%. This survey reveals that administrators and faculty are overall quite satisfied with conflict resolution on campus while staff are significantly less satisfied.


